The other day my wife and kids played a drawing game called Who What Where Jr with some friends. Based on their description of the game mechanics, I wrote a little bit of Javascript that chooses a "who", a "what", and a "where" from columns in a Google Spreadsheet.
I guess it's not quite the same as the actual game, and it took us a while to come up with subjects, verbs, and locations, but we had some fun creating it and playing it. The next step would be to turn this into a web app, including some sort of mechanism for showing each player a different phrase before a timer starts.
Code is available on GitHub.
Friday, December 30, 2016
Saturday, November 19, 2016
Class Group Formation With Student Choice and Algorithms
We needed to form new groups in my class of 28 students (seven groups of four), so I had the idea to allow some student choice. Students were able to choose six others that they would prefer to be with, and three others that they would prefer not be in a group with.
Each student is assigned a number from 1 to 28, and I generated possible combinations of 4 students chosen from those 28 (20 475 possible combinations).
Then I eliminated combinations that that contained a given student and a student that they indicated a preference for not being with, which narrowed it down to 7714 possible combinations.
From these 7714 combinations, I built sets of 28 unique students (seven groups of four with no repeating numbers in a set). This resulted in 259 possible class group configurations.
I then assigned points to those sets based on student preferences, one point for every "I want to be with ___" that was fulfilled. The set with the highest points was then chosen, and the numbers translated back into names.
That's just a broad overview of the algorithm design. Just for fun, I did different parts in Wolfram Cloud, Python, Javascript, and Excel.
Friday, October 21, 2016
Google Classroom Assignment Completion Leaderboard
I've been using Google Classroom to post a lot of assignments that students can work on at their own pace; some of them are optional assignments, but most are required. We also have incentives set up for milestones such as 500 assignments completed by the class.
Rather than having to go through each assignment and see how many have been completed, and how many each student has completed, I've written a script that logs that information to a Google Spreadsheet. In case you'd like to do the same, here's the code and some basic instructions on how to set it up for yourself.
- Create a Google spreadsheet with a list of student email addresses in column A starting at row 2.
- Rename the sheet Achievements (or change line 17 of the code below).
- Under the Tools menu choose Script editor and paste in the code below.
- Follow the directions at https://developers.google.com/classroom/quickstart/apps-script to authorize your script.
- Run (play) the function listCourses to find the courseId for the course that you want to run this on
- Set up a trigger to run the function countClassroomAssignments() every morning or every week.
Sunday, October 16, 2016
My Classroom Technologies
In my grade six classroom we have been using a number of different educational technologies, including hardware, software, and web-based tools.
Our main hardware platform is a set of Dell Latitude E6410 laptops. Since these are fairly old machines, we have reimaged them with Lubuntu, a lightweight Linux distribution that makes them quite usable. We have a charging cart, extra batteries, and an external battery charger.
On these laptops we have installed the Chrome web browser (in addition to the included Firefox), Audacity for audio recording, Cheese for taking photos and videos, and MinecraftEdu.
Also in the classroom we have two Raspberry Pi computers running KanoOS for computational thinking activities, and a few older gaming consoles for indoor recesses, motivation, and esports (a subject for another post).
We have access to Chromebooks, iPads, tripods (with iPad brackets), microphones (with USB cables and lightning adapters), green/blue screens, a GoPro HERO Session camera, Mac mini computers, Lego Mindstorms EV3 robot kits, and programmable Parrot Rolling Spider drones.
Our web-based tools include:
Google Classroom - assignments and online interactions, and guardian email summaries
Google Sites - hosts our class website
Remind - communicating with my students' grown-ups
Classcraft - a gamified behaviour management system
Mathletics - math practice
Math Live - interactive math lessons
Prodigy - chocolate-covered broccoli math practice
Newsela - news and non-fiction at adjustable reading levels
Duolingo - French language learning
Kids A-Z (Raz-Kids) - optional reading (ebooks and audiobooks)
Code Combat - coding and computational thinking activities
And of course we use other platforms for occasional assignments, such as Marvel's Comic Creator or Weebly. We'll also be trying many other tools throughout the year. For the most part, though, we are not focusing on learning tools, but rather learning with the tools.
Saturday, September 3, 2016
Virtual Reality in Education
Apart from artificially intelligent assistants, I think virtual reality technologies (and the related technologies of augmented reality) are one of the next big things in education. Not as in "flavour of the week", but rather things that can make a significant impact on learning and engagement. This post will just scratch the surface, and hopefully spark some exploration.
You may have heard of, or used, virtual reality (VR) headsets that are based on mobile devices, such as Cardboard, Gear VR, or innumerable other headsets with similar designs. There are even specifically educational developments for these, such as Google Expeditions.
However I'm even more excited about more immersive and interactive VR experiences that can be had with hardware designed for video games. Of course they're somewhat more expensive, but you may be able to justify it based on the fact that the computers that run them can also be used for other tasks such as media production. Or if your school has a video game club or team, there are some VR hardware options coming out for consoles this year, but many of the education-applicable software and simulations won't be available for them.
At this point the two main options for computer-based VR are Vive and Rift. Both are in the neighbourhood of $1000, plus you need a decent gaming computer (which has gotten cheaper recently). While the Rift is, for now, primarily designed for sitting experiences, you'll likely want some space for room-scale experiences.
Okay, on to some educational applications.
Similar to mobile-based headsets, students will be able to view and sometimes interact with more and more 3D and 360 content that is being developed. More than just virtual field trips, this will allow students to experience things that are inaccessible or impossible in physical reality.
If you teach art or 3D design, check out Tilt Brush. It's somewhere between painting and sculpting. When I first used a pressure-sensitive stylus I was inspired to become a better artist, Tilt Brush took that feeling one step farther.
In grade six science we study flight, there are a number of interesting flight simulators available such as Fly Inside, Digital Combat Simulator, and War Thunder. Which reminds me, I need to check out DRL FPV simulator for virtual drone racing.
There are also a number of therapeutic applications of VR being developed. I'm interested to see if and how we can implement some of these in education.
And we continue to see interactive simulations being developed for consumers or professionals that can be implemented in, or adapted to, learning in school. But of course the biggest potential comes from empowering students to craft their own virtual reality experiences.
Wednesday, August 10, 2016
Open Data and Coding Project for Grade Six Social Studies and Math
I've recently put together a project-based learning challenge related to Alberta Education's grade six curriculum for social studies and mathematics. It involves open data released by governments, and coding-based graphing. Feel free to use it however you see fit, and let me know if there's anything that could be tweaked or improved.
The essential question is, "What data are available from governments, what use can we make of it, and what are some other things we would like to know?"
I've created two jsfiddle starting points for students to graph data:
and a map they can use as an example of displaying geographic data:
https://www.google.ca/maps/@53.6277799,-113.3259701,10z/data=!3m1!4b1!4m2!6m1!1s1tRWTjGzElTe2l5vo981zgWZQBE8
The curricular outcomes that would likely relate to students' projects are:
The essential question is, "What data are available from governments, what use can we make of it, and what are some other things we would like to know?"
Use data from data.strathcona.ca, data.edmonton.ca, open.alberta.ca, open.canada.ca, or somewhere else to:
- Construct a line graph of some statistic over time using HighCharts code from one of these examples: frequency of baby names or population of Sherwood Park and
- describe the trend or trends in the data and brainstorm reasons
- hypothesize what those data might look like in the future, and why
- investigate how those data were collected
- Assemble a map of essential (or interesting) services provided by Strathcona County, the City of Edmonton, and/or Alberta (e.g. this one) and
- compare how these are different in urban versus rural areas
- explain why you think that level of government is responsible for those services
- propose how the public could get involved in the expansion of those services
- Design a questionnaire to solicit opinions of other students, staff, and parents about either or both of the previous challenges.
- Write and send a letter to an elected official describing either or both of:
- your findings from one or more of the previous challenges
- suggestions for data sets that could or should be available (e.g. spending or locations).
I've created two jsfiddle starting points for students to graph data:
and a map they can use as an example of displaying geographic data:
https://www.google.ca/maps/@53.6277799,-113.3259701,10z/data=!3m1!4b1!4m2!6m1!1s1tRWTjGzElTe2l5vo981zgWZQBE8
Social Studies:
Benchmark Skills and Processes:
Dimensions of Thinking:
critical thinking and creative thinking: assess significant local and current affairs from a variety of sources, with a focus on examining bias and distinguishing fact from opinion
historical thinking: use primary sources to broaden understanding of historical events and issues
geographic thinking: construct and interpret various types of maps (i.e., historical, physical, political maps) to broaden understanding of topics being studied
decision making and problem solving: propose and apply new ideas, strategies and options, supported with facts and reasons, to contribute to decision making and problem solving
Research for Deliberative Inquiry:
research and information: determine the reliability of information, filtering for point of view and bias
6.1: Citizens Participating in Decision Making
General Outcome: Students will demonstrate an understanding and appreciation of the dynamic relationship between governments and citizens as they engage in the democratic process.
6.1.4 - analyze the structure and functions of local governments in Alberta by exploring and reflecting upon the following questions and issues:
How are representatives chosen to form a local government (i.e., electoral process)?
What are the responsibilities of local governments (i.e., bylaws, taxes, services)?
How are local governments structured differently in rural and urban settings?
What role is played by school boards (i.e., public, separate, Francophone) within local communities?
6.1.6 - analyze how individuals, groups and associations within a community impact decision making of local and provincial governments by exploring and reflecting upon the following questions and issues:
How can individuals, groups and associations within a community participate in the decision-making process regarding current events or issues (i.e., lobbying, petitioning, organizing and attending local meetings and rallies, contacting elected representatives)?
How do associations such as the Association canadienne-française de l'Alberta (ACFA), the Métis Nation of Alberta Association (MNAA) and the First Nations Authorities (FNA) provide their members with a voice, at local and provincial levels, exercising historical and constitutional rights?
In what ways do elected officials demonstrate their accountability to the electorate (e.g., respond to constituents, participate in local events, represent and express in government meetings the concerns of constituents)?
Math:
Statistics & Probability - Data Analysis
General Outcome: Collect, display and analyze data to solve problems.
Specific Outcome 1: Create, label and interpret line graphs to draw conclusions.
Communication | Connections | Problem Solving | Reasoning | Visualization
Specific Outcome 2: Select, justify and use appropriate methods of collecting data, including:
Questionnaires, Experiments, Databases, Electronic media.
[ICT: C4 - 2.2, C6 - 2.2, C7 - 2.1, P2 - 2.1, P2 - 2.2]
Specific Outcome 3: Graph collected data, and analyze the graph to solve problems.Friday, May 27, 2016
Technology Ideas to Enhance Classrooms and Makerspaces
not that a classroom can't also be a makerspace, in fact some argue that every classroom should be
Here are are a few cool things you can try with students of almost any age. Some off these are expensive, some are free. Try things and share your experiences.


Here are are a few cool things you can try with students of almost any age. Some off these are expensive, some are free. Try things and share your experiences.
Hour of Code
A basic introduction to coding and computational thinking concepts.
A good starting point before moving on to other projects.
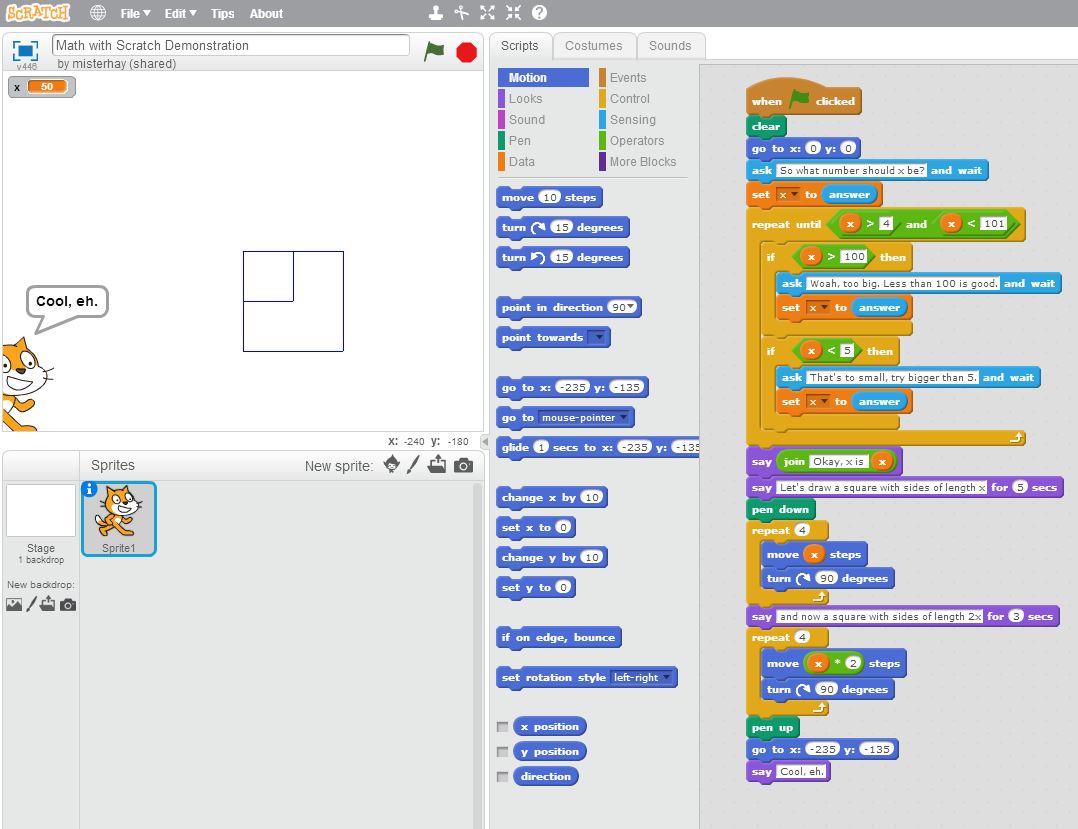
Scratch Programming
A graphical (drag and drop) programming environment for creating games, animations, interactive stories, and presentations.
- Can be used by any students that can read (probably best in grade 3 and up).
- Works great on Chromebooks or any other machines.
- There is also ScratchJr on tablets for younger students.
e.g. “Math with Scratch Demo” by MisterHay
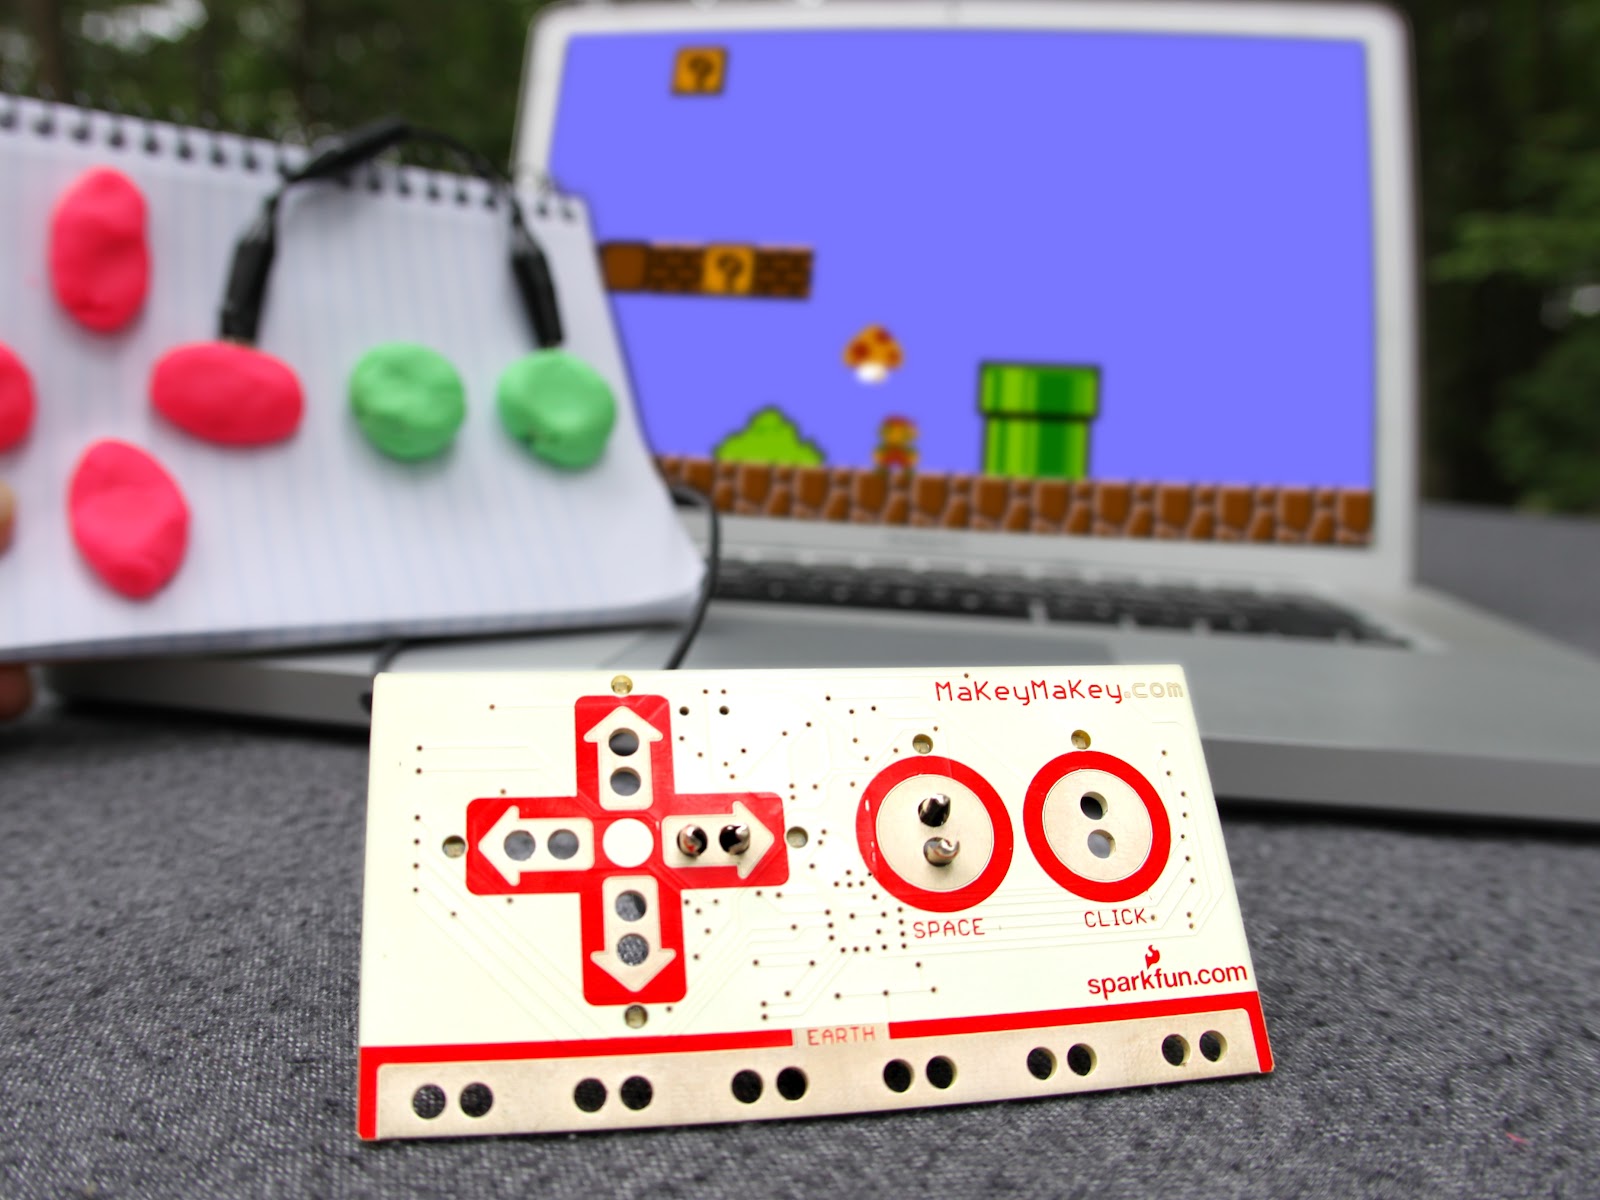
Makey Makey
A small circuit board for interfacing real-world things with a computer/Chromebook.
- Use wires to connect anything conductive, the computer sees it as a keyboard and mouse.
- Works great with Scratch
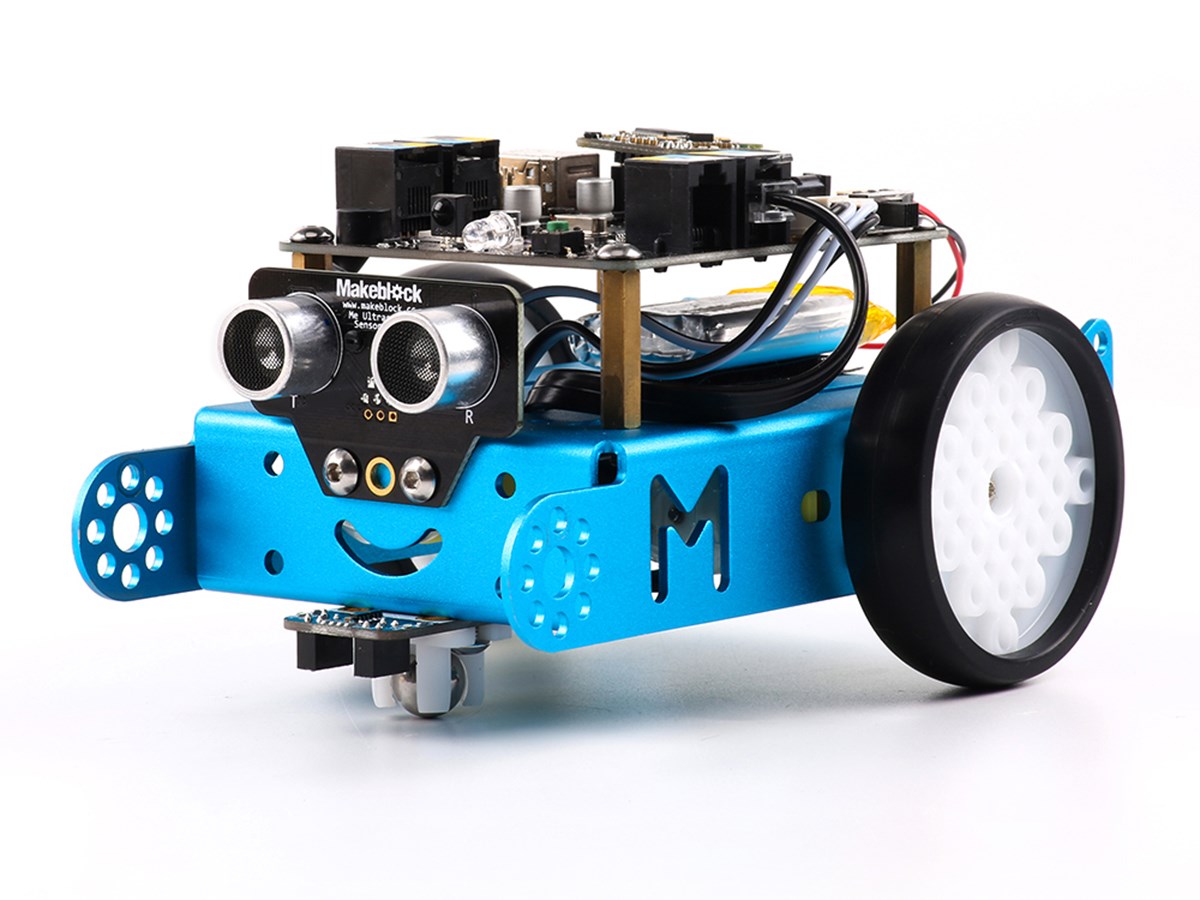
mBot Robot
mBot is an easy-to-use and inexpensive ($100 or so) programmable robot.
Features:
- Wireless connection to the computer
- Two motors
- Two RGB LEDs that can be programmed to display almost any color
- Speaker (for playing tones/notes)
- Infrared transmitter and receiver for communicating with other mBots, TVs, etc.
- Ultrasonic distance sensor
- Line follower sensor (can tell whether it is on a dark line or not)
It can be programmed with mBlock, which is based on Scratch, or via Arduino code.
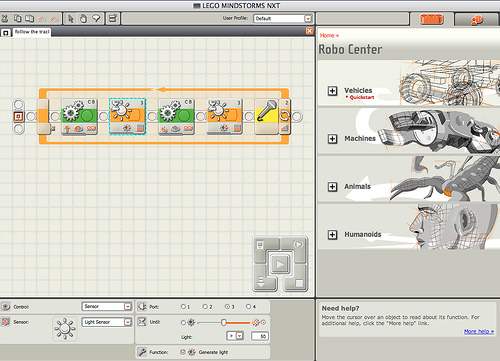
e.g. line follower by JohannHöchtl
LEGO Mindstorms
On a related note, check out LEGO Digital Designer (for Windows or Mac) and Build with Chrome (for Chrome).
Raspberry Pi computer
A small, inexpensive (less than $50) single-board desktop computer.
- Just requires a monitor, keyboard, mouse, and cables.
- KanoOS is kid-friendly and has a number of great coding activities built in.
- Many interesting projects have been built with them.
Virtual Circuits
123d.circuits.io allows students to create virtual circuits. Works on Chromebooks or other computers.Google Cardboard Virtual Reality Headset
Very inexpensive, about $5 each.
Requires a relatively recent Android phone or iPhone (4S or newer).
Experience VR games and simulations
Watch 3D and/or 360° videos.
- e.g. YouTube 360° channel
Students may even be able to record VR photos and videos using mobile apps.
Stop Motion Animation
On a Chromebook or any computer with a webcam: Chrome Stop Motion Animator app
iPhone, iPod, iPad: LEGO Movie Maker app, Imotion How too use Imotion
Many Android stop motion apps available as well.
Video and Audio Production
e.g. video projects, podcasts, radio dramas
Chromebooks:
Mobile Devices:
- And many others
Quadcopter Drones
EIPS owns (and insures) two Phantom 3 video drones for schools can borrow.
Students can also fly smaller indoor drones such as a Syma X2.
For examples of videos with drones, see http://haytech.blogspot.ca/2016/04/drone-videography-examples.html
Saturday, April 30, 2016
Drone Videography Examples
For some shots that are better filmed and produced, check out How to pull off five essential drone shots and uplift your videos. I've borrowed some of their ideas as well.
- Bird’s eye view
- Looking out
- Looking down
- Reveal
- Pull back (or fly towards) a sign or building
- Peek over fence or building
- Tilt up as you fly towards person/object
- Fly over ledge
- Fly up
- From object or sign on ground
- From person or object
- With or without rotation
- Along vertical structure or point of interest
- Fly by
- From above
- From beside
- With or without pan
- Tracking shots
- Beside
- Follow
- Lead
- Aerial panoramic
- Crane
- Point of interest orbit (full or partial circle)
- Aerial Timelapse
- Fly through (only for advanced pilots)
Did I miss anything, or is this list too granular?
Subscribe to:
Posts (Atom)


